
17 -- A tour of every instrument
Every instrument kind used once along one beam line. A 30 fs, 50 nJ pulse at 800 nm (pre-chirped with 300 fs²) goes through:
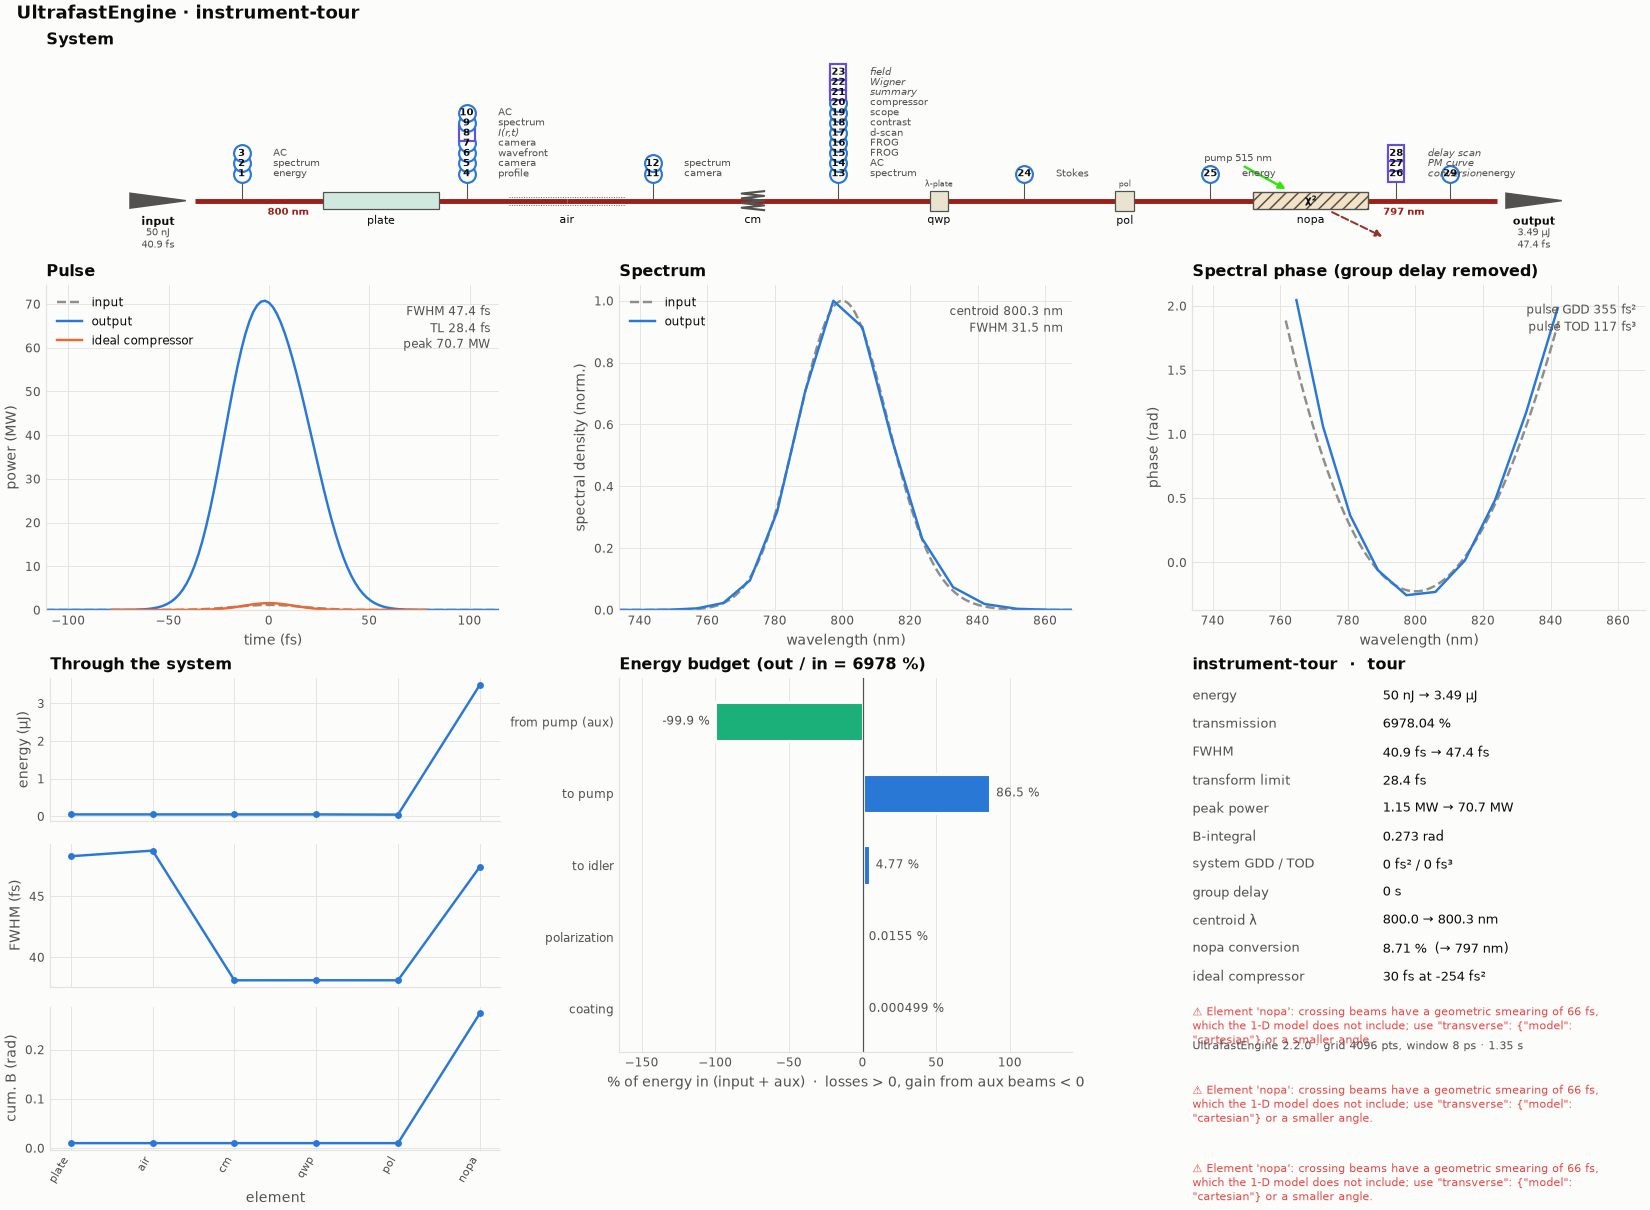
The overview figure of this example's run (python make_figures.py redraws it; the file is hero.png).
- a 3 mm fused-silica plate on a radial grid (SPM, weak Kerr lens);
- 30 cm of air;
- chirped mirrors;
- a quarter-wave plate at 15° and a polariser;
- a non-collinear OPA in BBO pumped by a 515 nm, 40 µJ pulse.
ultrafast run tour.ufs run.json -o results
ultrafast-plot results          # instruments.png: one numbered panel per instrument, located on system.png
| where | instruments (kind) | what they show here |
|---|---|---|
| input | energyMeter, spectrometer, autocorrelator (interferometric) |
50 nJ, 31.4 nm FWHM, 8:1 IAC |
| after the plate | beamProfile, camera (near field and far field), wavefrontSensor, spaceTime (virtual) |
w = 200 µm, M² = 1.000, Kerr-lens wavefront R ≈ 21 m, far field 637 µm at f = 0.5 m |
| after the air | camera (12-bit) |
w = 434 µm |
| after the chirped mirrors | spectrometer (dB), autocorrelator, frog (SHG and PG), dscan, contrast, scope, compressor, pulseSummary, wigner and fieldProbe (virtual) |
FWHM 38 fs vs 30 fs TL; the d-scan optimum is −7.1 mm of extra glass, the ideal compressor wants −254 fs² |
| after the quarter-wave plate | polarimeter |
s = (0.75, 0.43, 0.50), azimuth 15°, ellipticity 15° |
| after the polariser | powerMeter |
87 % transmitted |
| the OPA | conversion, phaseMatchingCurve, delayScan |
70× gain to 3.5 µJ, 1.9 µJ idler, 226 nm phase-matching bandwidth, optimum delay −50 fs |
Sampling: what the instrument actually sees
Three more instruments look at the beam through an aperture instead of collecting all of it
("sampling", see docs/instruments.md):
| instrument | sampling | transmitted | result |
|---|---|---|---|
spectrum_nf_pinhole |
near field after the plate, 20 µm pinhole on axis | 2.0 % | FWHM 31.5 nm (whole beam 31.4 nm): the plate's SPM is weak |
spectrum_ff_fibre |
far field after the air (f = 0.1 m lens), 25 µm fibre, NA 0.22 | 7.4 % | centroid 799.78 nm, 0.4 nm bluer than the whole beam: the focal spot is smaller at shorter wavelengths, so a fibre couples the blue better |
ac_nf_slit |
near field after the plate, 30 µm slit | 11.9 % | AC FWHM 68 fs |
Example 11 shows the same instruments on a beam with strong spatio-temporal coupling, where on-axis and whole-beam measurements differ clearly.
See docs/instruments.md for every parameter.