
27 -- Nonlinear ellipse rotation, driven by a digitised spectrum
Elliptically polarised light rotates its ellipse in a Kerr medium (nonlinear ellipse rotation, NER). This example sends a measured -- digitised -- 1030 nm spectrum with ellipticity 0.3 through ten 3 mm fused-silica plates and compares the rotation with the analytic result. It also shows what the engine does with a digitised spectrum and how a recording after the plates is compared.
cd docs/examples/Nonlinear/ner-measured-input
python make_data.py                        # optional: regenerates data/ (needs the engine built for Python)
ultrafast run plates.ufs run.json -o results
python ner.py                              # rotation vs analytic: Raman anisotropic / isotropic / off
The digitised spectrum
data/spectrum_digitised.csv is what a digitiser hands over: 950–1110 nm, a flat floor of 0.66 % of the peak,
29 rows out of wavelength order, one repeated wavelength and a little noise. The run spec cleans it:
"spectrum": { "csv": "data/spectrum_digitised.csv", "background": "auto", "threshold": 0.002 }
  Measured spectrum: 29 row(s) were out of wavelength order (typical of digitised curves) and were sorted.
  Measured spectrum: 1 row(s) repeated a wavelength and were merged with their neighbour (intensity and phase averaged).
  Measured spectrum: background 6.618 subtracted (0.658 % of the peak, auto: median of the darker edge).
Without background the run warns about the floor, and the floor spreads light over the whole 160 nm: the
transform-limited FWHM drops from 240 fs to below 30 fs (a sharp spike on a weak background), and the reported
B-integral doubles (3.1 rad instead of 1.4). A repeated
wavelength used to turn every result into NaN; it is now merged. See
Measured data.
The window
Each plate has AR-coated faces (0.2 % per face), so each makes a ghost of 4·10⁻⁶ about 29 ps behind the pulse.
The window makes room for the satellites that reach grid.satelliteLevel (10⁻⁸) -- the ten coincident single
ghosts add up to 4·10⁻⁴, double ghosts stay far below -- instead of every order of every plate:
Satellites: the window makes room for 58.56 ps of ghost/replica delay (...); the longest delays of all 10 sources added up would need 292.8 ps.
The rotation
B-integral of linear light: 1.525 rad; ellipse angle chi = 16.70 deg

Raman response                      azimuth (deg)   analytic
anisotropic, b = 0.25 (default)             10.23      10.07
isotropic, b = 0                             9.45       9.31
off (electronic Kerr only)                  11.53      11.34
The analytic value is θ(t) = B(t) sin 2χ [(1 − fR)/3 + fR b/2] (electronic Kerr: B sin 2χ / 3), averaged over the pulse as the polarimeter does. The engine is within 2 % in all three cases; the small common excess comes from the pulse shape after cleaning and the plates' dispersion. The anisotropic part of the fused-silica Raman response (b = 0.25, Hellwarth) adds 8 % to the rotation compared with an isotropic Raman response; switching Raman off gives the largest rotation because all of the nonlinearity is then electronic. The physics is in Nonlinear physics.
The recording after the plates
data/spectrum_osa.csv is an OSA trace after the plates: 0.5 nm resolution, 1010–1050 nm only, a dark level of
40 counts and noise. The simulated spectrometer is ideal; the comparison blurs it to the recording's resolution,
compares only where both have readings and removes the dark level from the darker edge:
  measured data:
    osa                    spectrometer   chi^2 18.55      (401 points)  rms error 0.43 %
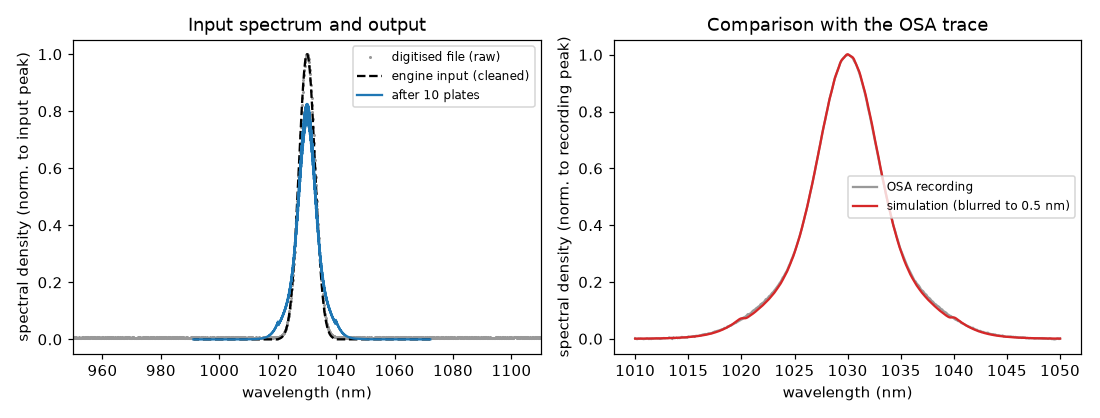
python plot.py draws this figure from results/. On the left, the grey dots are the raw digitised file: the flat
floor is visible over the whole 160 nm range, and the engine input (dashed) is the same spectrum after the floor
was removed, with no light outside the measured range. After the ten plates (solid) the peak is lower and the
wings are broader, as SPM spreads the spectrum. On the right the simulated spectrum, blurred to the OSA's 0.5 nm
resolution, lies on top of the recording, including the shoulders at about 1020 nm and 1040 nm that come from the
shape of the measured input. Because the input is the measurement itself, this agreement tests the Kerr and
dispersion model, not the input.
The rms error is the noise of the recording. ultrafast-plot results draws the comparison in measurements.png.