
11 -- Self-focusing in a glass plate (spatial model)
A 4 uJ, 300 fs pulse at 1030 nm (~3x the critical power for self-focusing in fused silica) goes through 10 mm of fused silica with a 100 um collimated beam, then 4 x 10 mm of free space. The plate has a radial (Hankel) transverse model, so diffraction, the radially varying Kerr phase and the coupling between space and time are all resolved. The transverse profile then travels with the beam: the free-space steps (also radial) carry it exactly and show the Kerr focus and the divergence after it.
ultrafast run kerr.ufs run.json -o results-run
ultrafast run kerr.ufs run-linear.json -o results-run-linear    # same, at 1 nJ (no Kerr effect)
ultrafast-plot results-run
Spatial runs gain most from a GPU: ultrafast run kerr.ufs run.json --backend auto puts the radial elements on the
device when one is found (GPU).
Beam radius (1/e^2, second moment, energy-weighted over the spectrum) after each element:
| element | linear (1 nJ) | 4 uJ |
|---|---|---|
| plate (10 mm) | 102.5 um (Gaussian optics: 102.5) | 97.8 um, converging (wavefront R = -81 mm) |
| + 10 mm | 114 um | 99 um (just past the Kerr focus) |
| + 20 mm | 133 um | 114 um |
| + 30 mm | 157 um | 138 um |
| + 40 mm | 183 um (Gaussian optics: 183) | 167 um |
Diagnostics after the plate (instruments 3-6 on the system diagram):
| linear | 4 uJ | |
|---|---|---|
| wavefront sensor: radius of curvature | +142 mm (diverging; = R inside the glass / n) | -81 mm (the Kerr lens makes it converge) |
| wavefront beyond defocus (mostly spherical) | 1e-5 waves rms | 0.007 waves rms |
| far field (f = 0.5 m): divergence half-angle | 3.28 mrad | 3.70 mrad |
| space-time (virtual): FWHM on axis / at r = w | 300 / 300 fs | 242 / 325 fs |
The space-time map shows what no single camera or autocorrelator can: the centre of the beam is compressed (SPM plus self-steepening on axis) while the wings are not.
Where the instrument looks: near field, far field, apertures
A real spectrometer or autocorrelator rarely sees the whole beam: it looks through a fibre, a pinhole or a slit,
often in the focal plane of a lens. With spatio-temporal coupling the answer depends on where. The run adds
spectrometers and autocorrelators with a "sampling" block (see docs/instruments.md):
| instrument (after the plate) | sampling | transmitted | spectral FWHM / rms width | AC FWHM |
|---|---|---|---|---|
spec_whole, ac_whole |
whole beam (default) | 100 % | 5.31 / 2.65 nm | 415 fs |
spec_nf_axis, ac_nf_axis |
near field, pinhole r = 15 µm on axis | 6.1 % | 5.98 / 3.44 nm | 371 fs |
spec_nf_wing |
near field, pinhole r = 15 µm at x = 100 µm | 0.56 % | 5.09 / 2.17 nm | |
spec_ff_fibre |
far field (f = 0.2 m), fibre r = 25 µm, NA 0.22 | 0.28 % | 5.19 / 2.32 nm | |
ac_nf_slit |
near field, 20 µm slit through the centre | 17.8 % | 408 fs |
The centre of the beam has the most SPM (broadest spectrum, shortest pulse); the wings have almost none. The fibre in the far field mostly collects the low spatial frequencies, which are dominated by the large, weakly broadened part of the beam. A slit averages over a line, so it sits between the pinhole and the whole beam.
What to look at:
elements[*].beam-- radius and M^2 after each element (M^2 grows from 1.00 to 1.07: the Kerr lens is not parabolic across the beam).after_plate,after_gap(beamProfile instruments) -- fluence vs radius, true peak fluence.nf_plate,nf_end(near-field cameras, the second one a 12-bit sensor),ff_plate(far field in the focal plane of an f = 0.5 m lens),wfs_plate(wavefront and Zernike terms),space_time_plate(virtual: I(r, t)).- The B-integral (1.4 rad on axis) and the spectral broadening (
pulseSummary: the transform limit drops from 300 to ~207 fs). energyBudget: free-space propagation is exactly energy conserving (the only entry is Raman + solver error in the plate, ~1e-5). The engine warns if more than 0.01 % of the energy sits near the edge of a transverse grid; enlargeradiusM(keeping the point spacing) if it does.
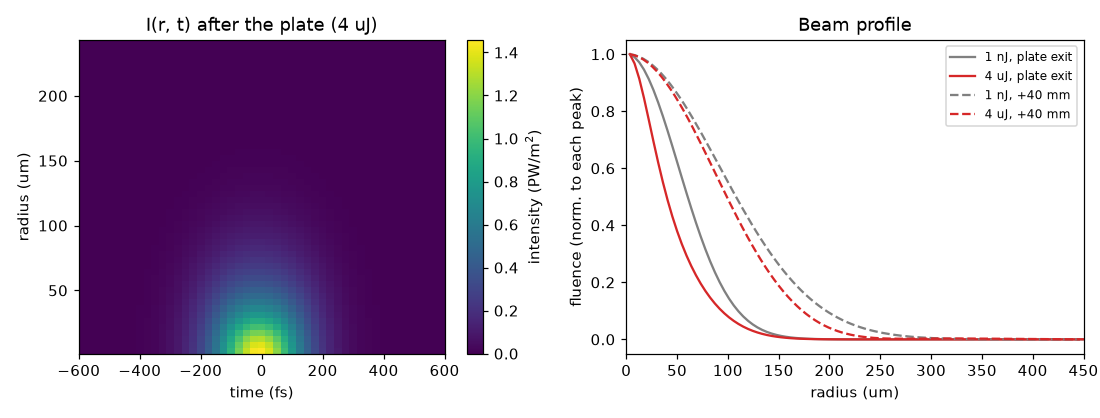
python plot.py draws this figure from results-run/ and results-run-linear/. The left panel is the intensity
after the plate as a function of radius and time, a quantity no single camera measures: the pulse is strongest and
shortest on the axis and weaker and longer in the wings, because the Kerr phase follows the local intensity. The right
panel compares the beam at 1 nJ (grey, no Kerr effect) and at 4 uJ (red). At the plate exit the intense beam is
narrower (97.8 um against 102.5 um): the Kerr effect acts as a weak positive lens and the beam is converging. After 40 mm of free
space it is still narrower than the linear beam (167 um against 183 um), since it has been focused
and has begun to diverge again from a smaller spot.
The same plate without "transverse" runs in 1-D (much faster) and warns that the peak power is above the
critical power -- this example is what that warning points to.